|
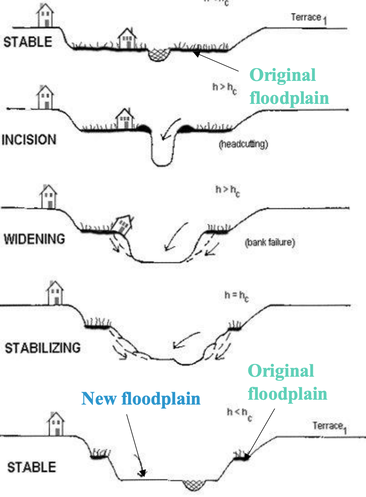
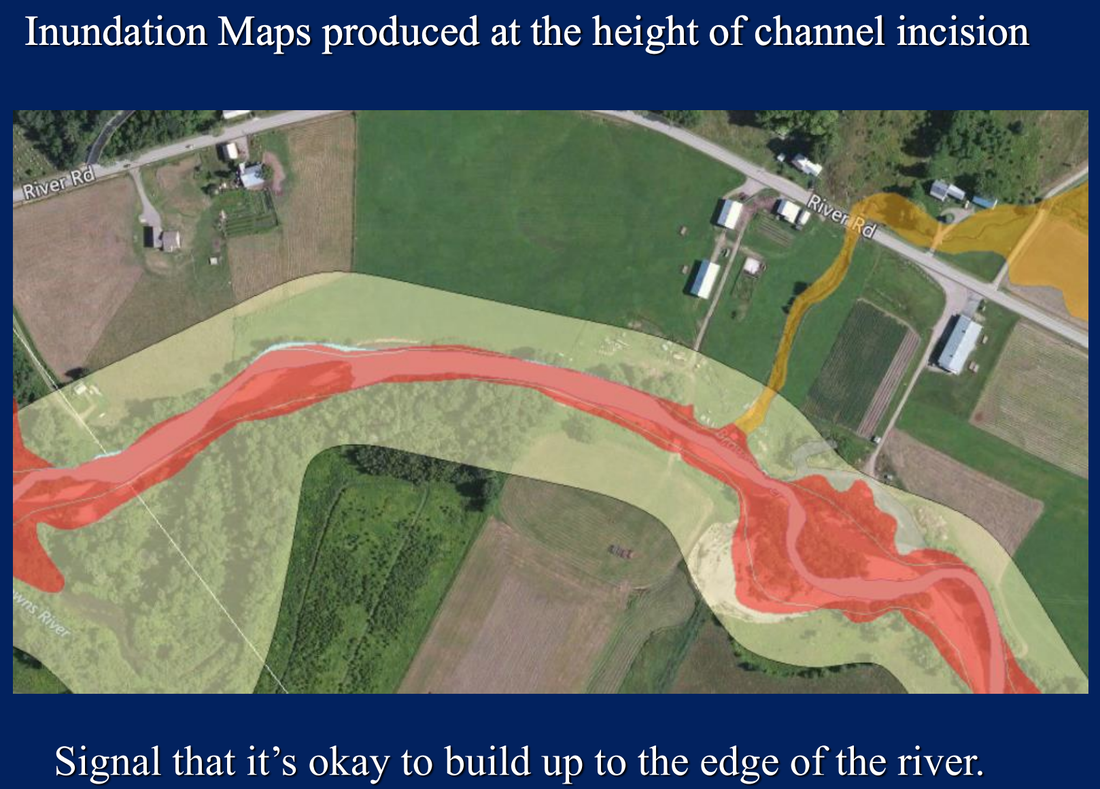
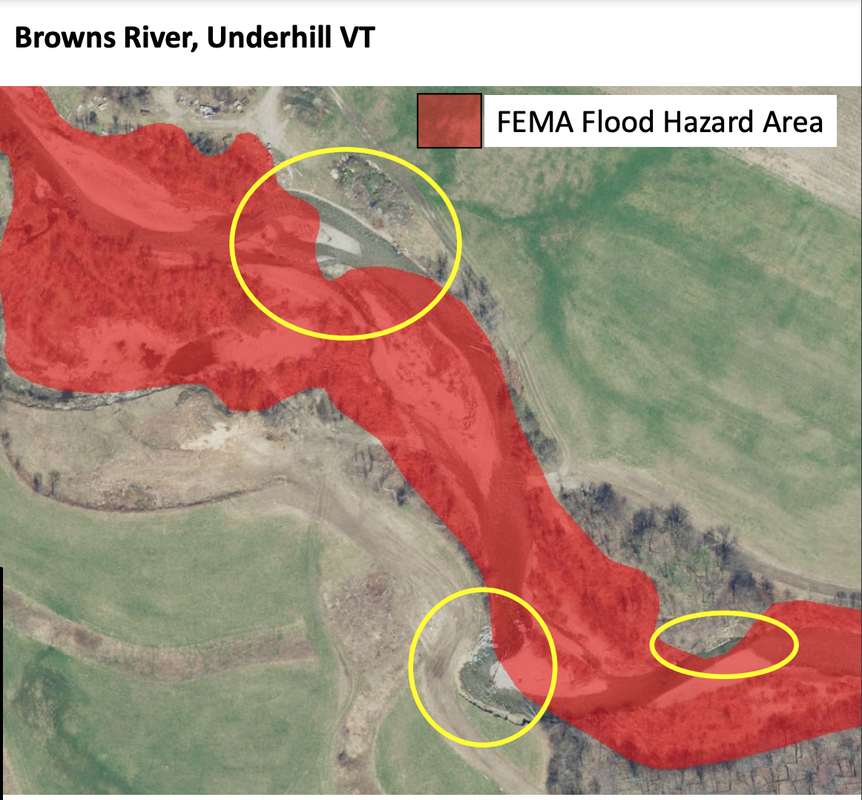
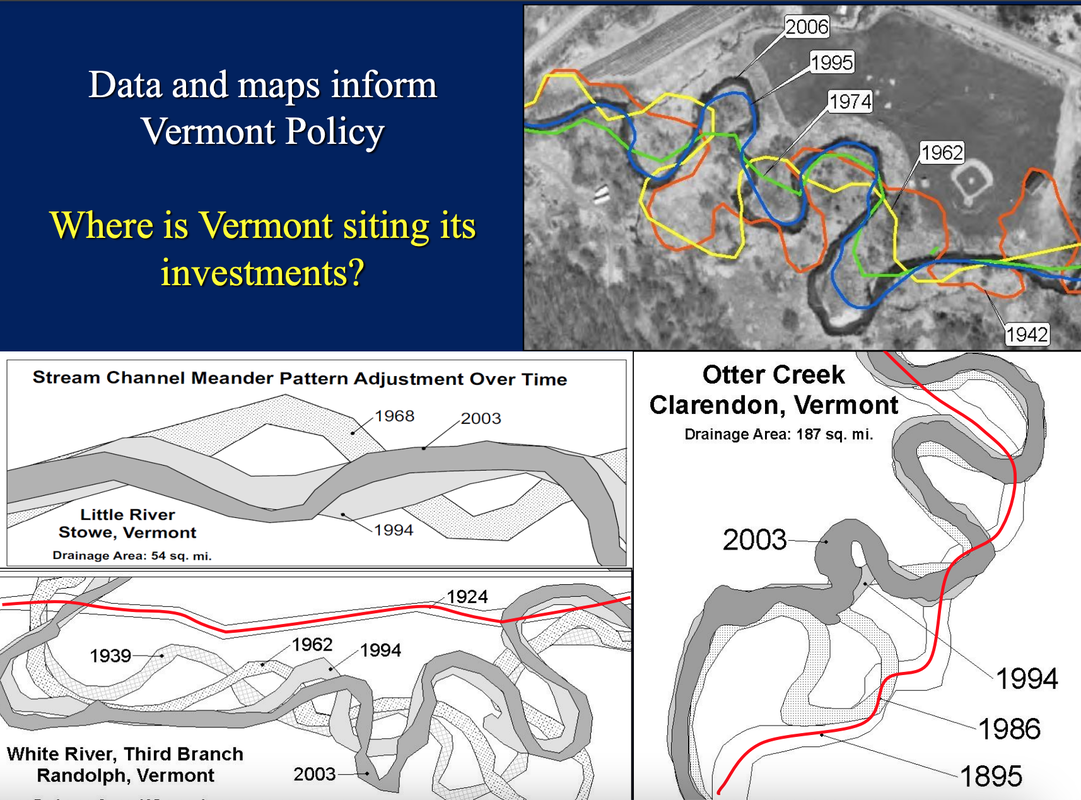
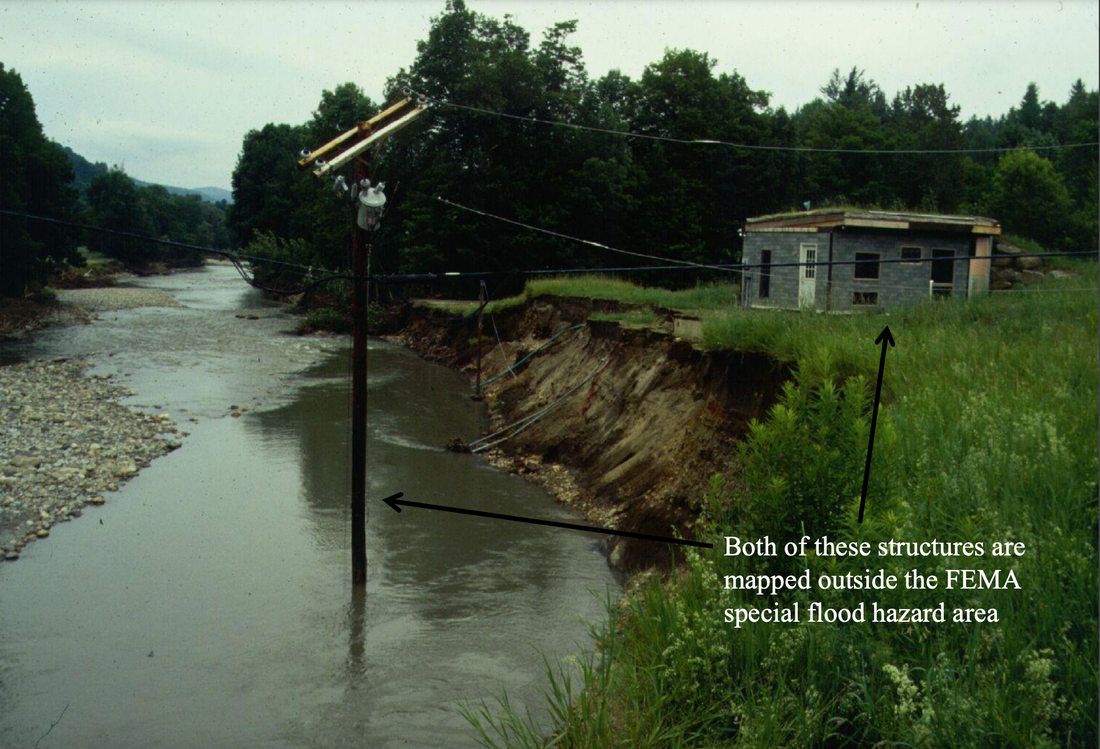
We had lots of great testimony again this week, and while we're starting to get into some policy conversations, Natural Resources and Energy is still feeling like a science class (and I'm loving it - feeling right at home!) So again, I want to share some images with you that I found compelling. All of these images are screen shots from the presentations this week either by Mike Kline, Rebecca Pfeiffer, or Rob Evans. These folks helped me understand how to look at FEMA flood maps, helped me have a better understanding of the difference between a flood plain and a river corridor, and helped me understand how what we saw during the summer, was a part of the natural cycle for rivers that have been altered. It all starts with the stages of river channel evolution, as seen in the image below. The "incision" stage is when humans have messed with the river, either by armoring, straightening, dredging, berming, or removing wood, etc. It's just a matter of time before those human interventions ultimately cause the river to widen and re-stabilize. Currently 73.5% of Vermont's rivers are "moderately to severely incised". It turns out that the last time FEMA came through Vermont to update their flood maps was in the 1970s, at the height of Vermont's river incision. So when FEMA ran their algorithm that added some additional volume of water to river channels, because of the incisions, the "flood plain" perfectly overlapped the river channel itself in many places. This is what we're seeing in the image below, where the red 100 year flood plain shares much of the same boundaries as the river channel, implying that those surrounding fields are somehow safe for construction. And of course those static maps from the 1970s are not super helpful when the river itself is moving around the landscape. Check out the image below from Underhill where the river channel has already moved so much that the channel is outside of the flood hazard area (circled in yellow). How much do rivers change their shape on the landscape? Quite a bit. We saw some great examples of this, but my favorite is from the Third Branch of the White River (bottom left in the image below), where you can see that we straightened the river in 1924, but the river was just not having that and continued to wiggle its way across the landscape. It's important to note that those FEMA maps are all about the inundation hazard area. (Another way of saying a 100 year flood area is an area with 1% annual chance of flooding. The 500 year flood area has a 0.2% annual chance of flooding.) Inundation is just when the water rises, like we saw in downtown Montpelier. So these maps do not include the area at risk from erosion risk, when the river decides its time to carve a new path or re-stabilize its banks. This was the kind of damage we saw in Cabot (and many other places) in July and in the image below. The erosion hazard area is what is supposed to be captured in the "River Corridor" maps. So when you hear "FEMA flood plain" think inundation risk (waters rise), and when you hear "River Corridor" think about those wiggly lines all over the landscape and erosion risk. That's what the white-ish area is around the red flood plain in the first map. A couple points of good news:
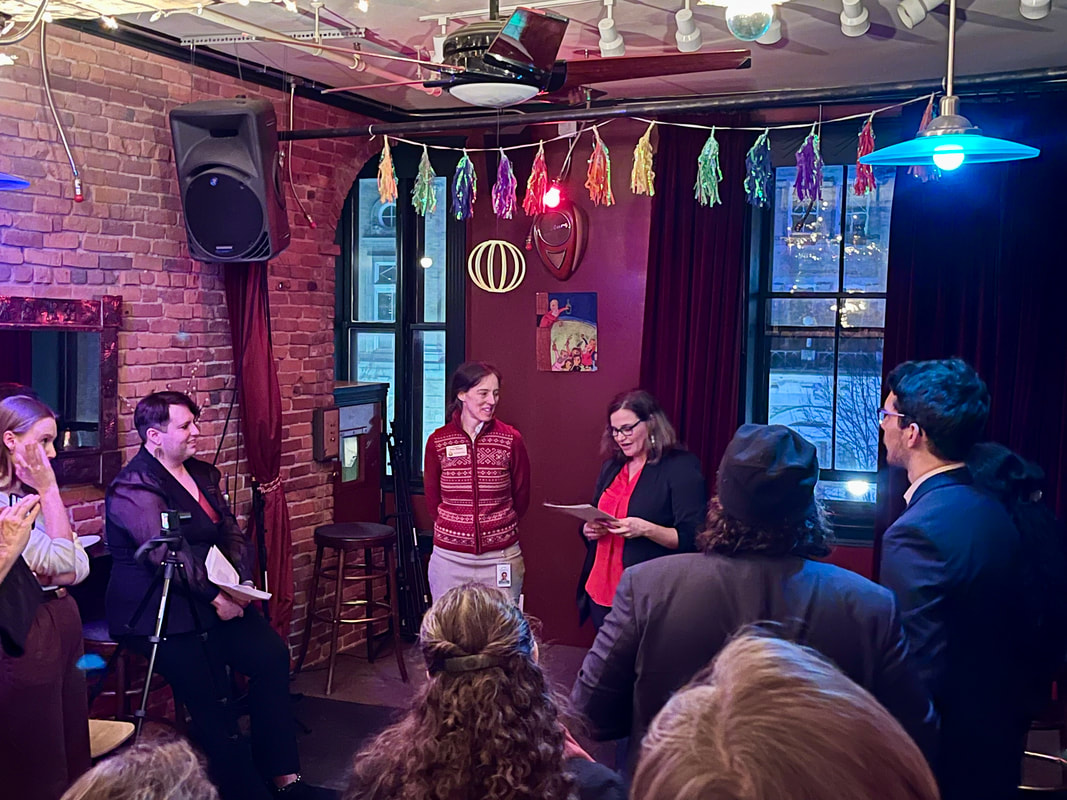
I think we can all agree that while we must build more housing, it should NOT be in these high risk areas. I received the Vermont Conservation Voters Rising Start Award!In other news, I received the Vermont Conservation Voters Rising Star award for the Senate! (yay!) A physical award is still in the works, but they gave me a bar of chocolate as a placeholder until the real award arrives. The picture below is from the award ceremony held at Hugo's Bar and Grill. Since I won this award, I was interviewed on the Vermont Conservation Voter's Climate Dispatch podcast, which you can listen to here.
Comments are closed.
|
Details
AuthorWrite something about yourself. No need to be fancy, just an overview. Archives
June 2024
Categories |

 RSS Feed